Evaluation and recommendations for Bayer AG's carbon accounting

Context/Problem:
Bayer AG is a multinational firm focusing on agriculture and pharmaceuticals. They publish an annual Carbon Disclosure Project report that contains their carbon emissions data, innovations, current actions within each sector, and energy generation and PPAs. However, they have extremely large Scope 3 (indirect) carbon emissions and fail to report on multiple categories.
Action/Solution:
I sought to provide recommendations about how Bayer could improve their carbon accounting strategies for more accurate and impactful reporting.
To begin, I reviewed the entirety of Bayer AG’s decarbonization strategy, including their Carbon Program, enhanced farming practices, internal energy efficiency projects, and local community partnerships. I compared this against their sectoral breakdown and finances to see which areas create the most impact.
It was found that the majority of their emissions were from Scope 3 in their crop science division in the United States. This was because agriculture produces significant emissions from fertilizers and transportation.
From there, I looked into their methodology of carbon accounting calculations. This included reviewing the Bayer Site Information System and comparing it against the Greenhouse Gas Protocol. Several problems were identified in the calculations of their Scope 2 and Scope 3 methodologies.
Scope 2 emissions were only calculated on “environmentally relevant” manufacturing sites, leaving out smaller production facilities under 1.5 TJ. Additionally, Scope 3 was missing several scopes in its reporting while utilizing the EEIO model for the purchased goods and services category, which was 70% of their Scope 3 emissions.
Utilizing the EEIO framework can be dangerous for goods and services. This is a framework that uses proxy data to estimate emissions based on economic transactions and sector averages. This means that if competitors or suppliers developed lower-emissions or more efficient products, Bayer could be underreporting.
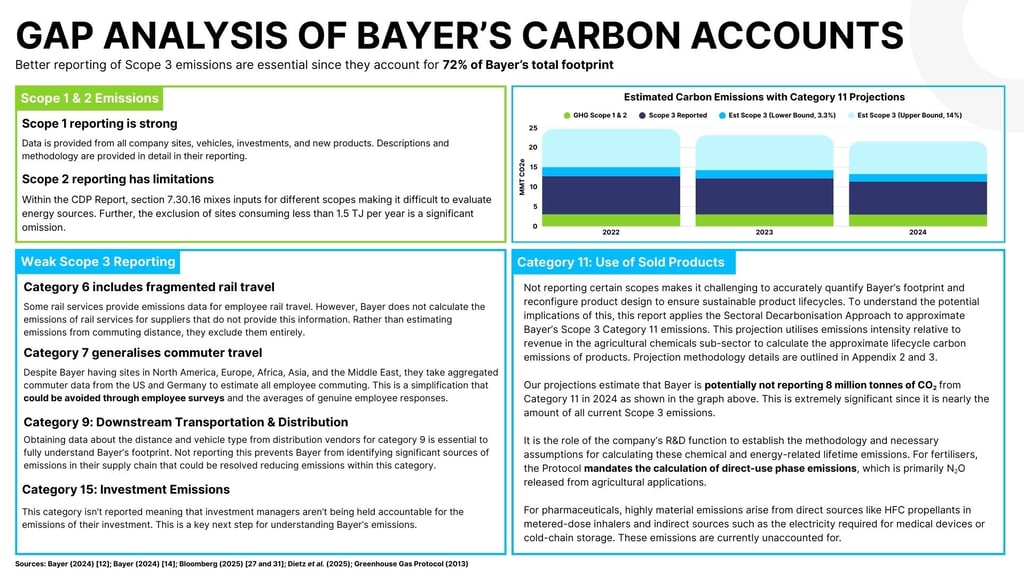
Their lack of Scope 3 emissions reporting was particularly concerning. I developed a projection of an estimated full Scope 3 emissions bracket, including unreported categories. The upper bound expanded the total Scope 3 emissions range by 14%.
Within Scope 3, several issues were identified:
Category 6 included employee rail transportation data. However, some rail providers did not make automatic carbon emission calculations. Therefore, Bayer excluded these trips rather than estimating emissions.
Category 7 calculated daily employee commuting emissions by aggregating commuter data from the general population of the US and Germany. However, Bayer has sites in North America, Europe, Africa, Asia, and the Middle East, where transportation methods vary drastically.
Category 9 calculated the downstream transportation and distribution data. Bayer failed to calculate this, despite having data about the distance and vehicle type of distribution vendors.
Category 15 about investment emissions wasn’t reported, despite similar companies like Johnson and Johnson performing due diligence on companies they held majority stakes in. Bayer has several companies that it owns 50-70% of, which it doesn’t report on.
Category 11 was the most extreme violation for not reporting the use of sold products. This makes it challenging to reevaluate products to ensure sustainable product lifecycles. While Bayer was technically following reporting requirements, they were barely within the realm of the Greenhouse Gas Protocol, which mandates the calculation of direct-use phase emissions in fertilizers.
Outcome/Impact:
I benchmarked Bayer AG against its competitors and industry, revealing that many agricultural companies struggle with their Scope 3 emissions. While Bayer was not the largest offender in the industry, their impact would be significantly higher with more intensive reporting.
Therefore, I developed a series of solutions to calculate their emissions in missing or underrepresented Scope 3 categories.
Category 6 - Employee rail travel emissions can be estimated using general rail proxy data and commuting distance. (Emissions factor for transit type x Miles Travelled)
Category 7 - Employee commuting habits can be calculated through employee surveys to learn the types of workplace commuting, vehicle type, and average behaviors across countries or offices.
Category 9 - To understand downstream distribution and transportation, Bayer can talk to suppliers about their fleet types, fuel mileage, and track distances for distribution.
Category 11 - Bayer can implement a higher budget towards research and development to measure lifecycle emissions. This can inform future product creation to manufacture regulation-compliant products. This could create company differentiation as regulations tighten in certain geographies.
Category 15 - Bayer could begin reporting on investment emissions using the same framework for their own company as part of the due diligence process.
These recommendations were classified by high, medium, and low priority, with the highest priority being the use of sold products.